
Mean Spirited
What consumer confidence and stock price trends tell us about mean regression for emerging growth companies


Two months ago, we found that an exclusive group in the Third Stream Research universe did astonishingly well. With a +35.9% gain for the 12 months ending April 17, 2023, the fifth quintile topped the S&P 500 Index by over 41 percentage points. That’s where the good news ended. Stocks in the other four quintiles were still mired in a severe bear market; in fact, the bottom three quintiles averaged a horrendous -67.7% decline.
Moving from the fourth to first quintiles, we saw a clear pattern: the stocks got progressively weaker on a fundamental basis and it’s strongly correlated with the size of the market capitalization and share price. In other words, the smaller the company, the more likely its stock performed badly over the past 12 months.
A fresh look at similar data indicates that bullish activity is rising.
This time around we removed the most fledgling nanocaps, leaving 853 in the count. As the table below illustrates, the top quintile is tearing it up, surging +136.4% over the past year. The leaders continue to be substantially larger companies with an average market cap of $424.7 million and an average stock price of $11.13.
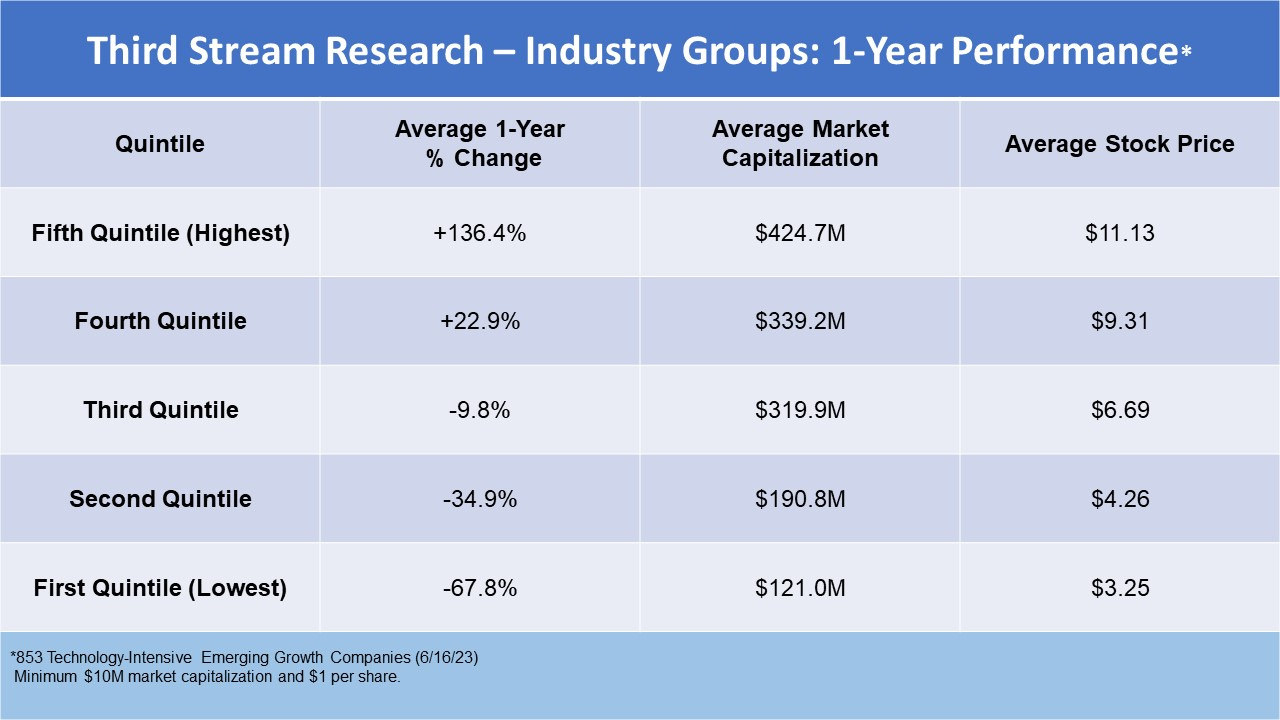
Notably, the fourth quintile joined the party, gaining +22.9%. In April, the same quintile was down -21.8%. While the exclusion of the smallest stocks reduced the negative impact of the weakest performers, our findings demonstrate a broadening support for emerging growth stocks, particularly small caps (>$300 million market cap).
Interestingly, 10% (85) of the stocks at least doubled in one year, with 28 tripling or better. An additional 80 stocks increased between 50% and 99%. Big winners aside, losers still outpace gainers by a 483 to 368 margin.
However, in last week’s Confluence, we cited the following year-to-date performance data, which illuminates a change that is underway this year:
“Third Stream Research tracks 1,200+ companies with market capitalizations below $1 billion, covering the TMT, Biotechnology, Healthcare/Life Science, Medical Devices, and Cleantech industries. The average YTD gain of all 1,237 stocks is 6.4%, which trails the Russell Growth Index by 4.5 percentage points. However, when we exclude all companies below the $10 million market-cap threshold and/or trading under $1 per share, the performance is strikingly improved: +15.2%, with winners outpacing losers by a 475 to 371 margin.”
These findings are revealing. What we’re seeing is an impressive shift in momentum among technology-intensive emerging growth stocks in 2023.
Consumer confidence rebounding off historical lows
Years of experience working with the proprietary macroeconomic data generated by the 451 Research Alliance’s survey network taught me that consumer sentiment is a valuable contrarian indicator at extreme tops and bottoms. In other words, when the data points were at long-term highs it was usually a signal that the stock market was forming a top, while long-term lows in consumer confidence suggested that stocks were ripe for buying.
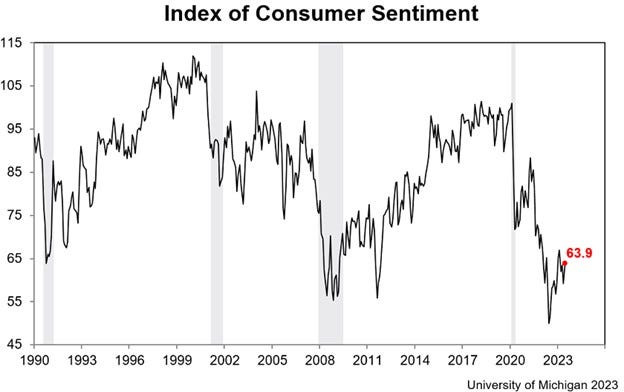
Sentiment, when distressed as it was in late 2022, is always a contrary indicator. “Every time the University of Michigan Consumer Sentiment Index goes below 59 has been an excellent entry point for investors with a two- to five-year horizon, notes Nicholas Colas, co-founder of DataTrek Research. While he said remarkably poor consumer sentiment over the past year may feel ominous, “history also shows it is a buy signal for U.S. stocks for investors who can afford to be patient over the next few years.”
The University of Michigan's Consumer Sentiment Index experienced a notable surge, rising by 8% in June to reach its highest level in four months. This upswing reflects a wave of greater optimism among consumers, spurred by easing inflation concerns and the resolution of the debt ceiling crisis by policymakers. Both the short-term and long-term outlooks for the economy saw significant increases, surging by 28% and 14%, respectively.
In 2012, 2020 and 2022, consumer sentiment reached historically low levels. Nearly coincident with these points the Russell 2000 Growth Index—the benchmark for Third Stream Research’s industry groups—began an upward trend as if on cue, going on to record strong gains in each of these periods.
Of course, investors should never base decisions for stock buying on any single indicator. Numerous macroeconomic factors such as interest rates, inflation and demand trends also must be considered, while micro characteristics unique to every small company are critical for assessing future performance.
Two technical indicators—percentage below 52-week high and price vs. 200-day moving average—reflect volatility in smaller tech and potential overextension for mega-tech
Analyzing and measuring volatility in small growth stocks is important to understand the potential risks and fluctuations associated with these investments. It is common knowledge that nanocap and microcap stocks in technology-intensive industries experience some of the highest volatility in all equity markets, and while this makes for risky business, it also creates exciting opportunities.
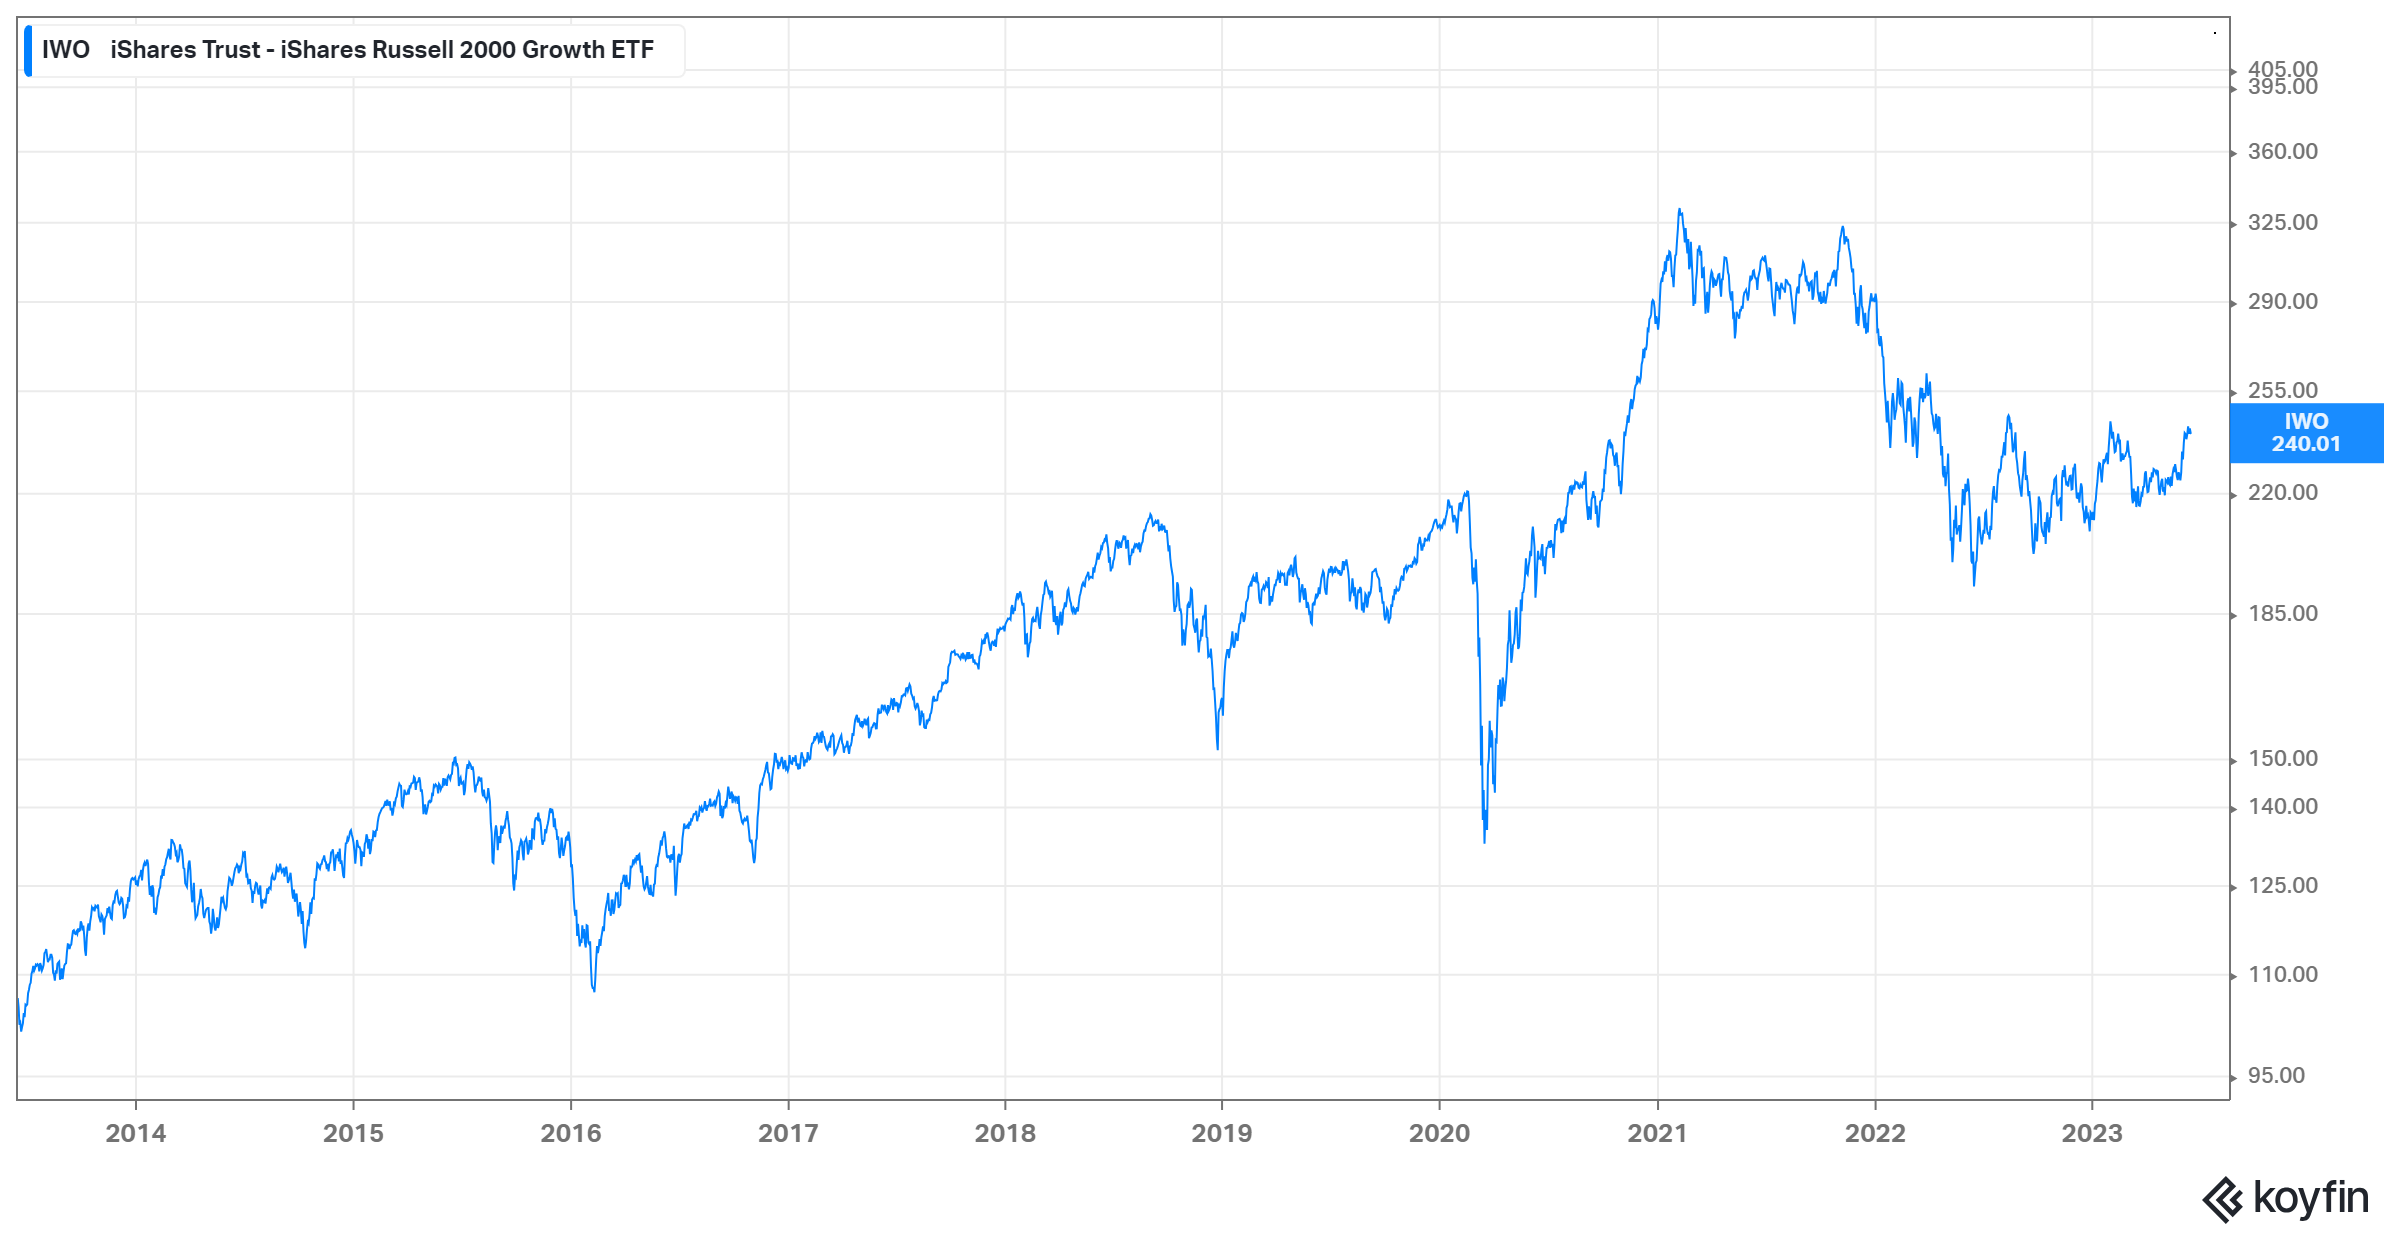
In the table below, we have a comparative view of the companies in Third Stream Research’s coverage universe in relation to the Russell 2000 Growth Index (IWO) and the big-tech dominated Nasdaq-100 (QQQ).
Two primary themes emerge from the data:
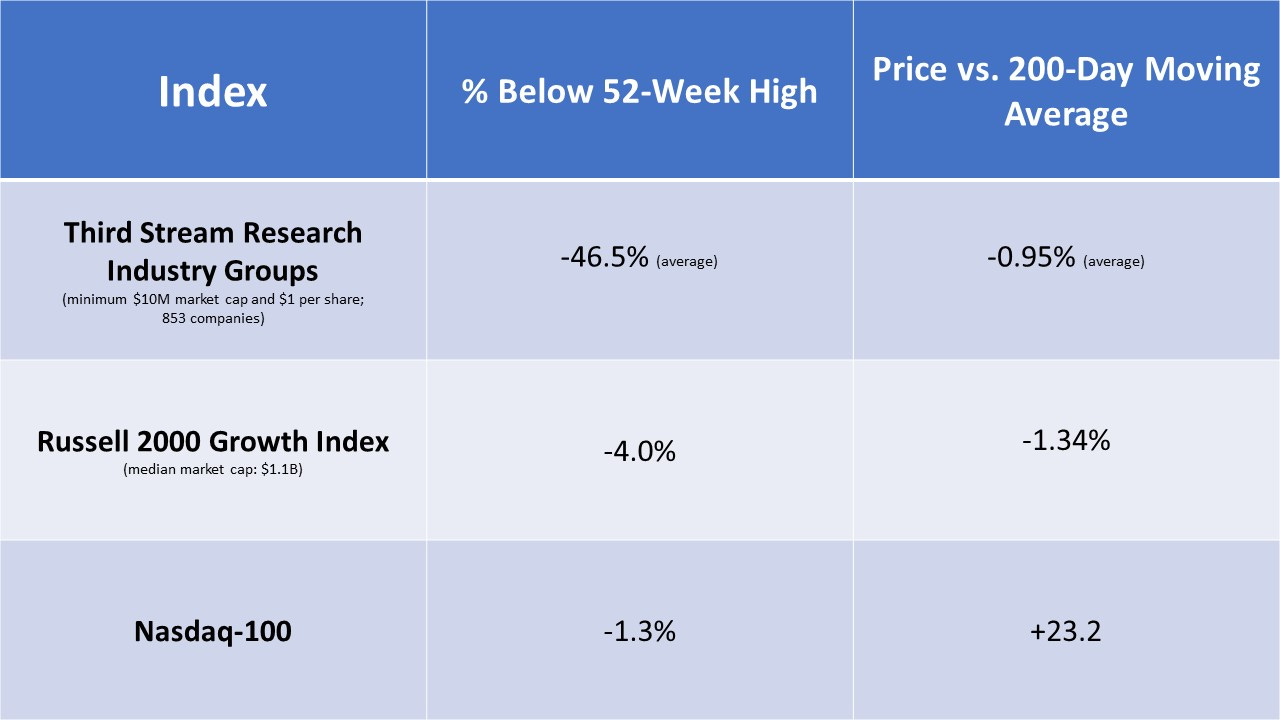
Both QQQ and IWO are trading near their 52-week highs. The QQQ has been particularly strong, led by the Big 7, featured in last week’s Confluence. Meanwhile, the 853 stocks (>$10M market cap and/or > $1 per share) in the Third Stream Research industry groups are trading at an average of nearly -47% below their 52-week highs. This reflects the volatile nature of these stocks, of which 502 (59%) are below $5.00. It also underscores the difficulties in determining advantageous entry points when building positions.
The biggest tech stocks on a price/sales basis are only mildly expensive by historical standards, though NVIDIA (NVDA) at 42x is pushing the boundaries. Amazingly, the Big 7 Mega-tech stocks (AAPL, MSFT, AMZN, GOOG, NVDA, META and TSLA) are trading at an average of +130% above their 200-day moving average. This compares to -1.34% for IWO and -0.95% for the Third Stream industry groups, respectively. Note that it’s rare for QQQ to trade below its 200-day moving and it had traded as high as +71% above this indicator as recently as November 2021 (during the peak of the pandemic) before trending below the line throughout Q4 2022.
Quantitative data like this is useful for understanding broad market trends and in comparative analysis of different stock groups. However, as we discussed here, Third Stream Research’s methodology is differentiated by our emphasis on qualitative analysis and especially innovation, intangibles, and narratives. Once these areas along with fundamentals are addressed, then a technical perspective serves an important role in helping to identify asymmetries of information flow, price anomalies, and attractive entry levels to accumulate positions.
See you next week, and thank you for your support.
Josh
Connect with me on Twitter and LinkedIn.
Disclaimer
The content provided in this newsletter is intended to be used for informational purposes only. It is important to do your own analysis before making any investment based on your own personal circumstances. You should take independent financial advice from a professional in connection with, or independently research and verify, any information that you find on our website and wish to rely upon, whether for the purpose of making an investment decision or otherwise. Joshua Levine and Third Stream Research were not compensated by any company, directly or indirectly, mentioned in Confluence, and we do not own shares in any companies mentioned.